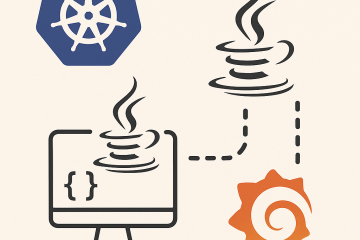
Java, Spring Boot, AWS, Microservices
Monitoring Java Applications with Prometheus and Grafana on Kubernetes
Introduction Modern microservices-based architectures rely heavily on observability to ensure applications perform reliably at scale.For Java applications running on Kubernetes, Prometheus and Grafana are the standard tools for monitoring and visualization. Together, they offer a flexible system for collecting, storing, and analyzing metrics — allowing developers to detect issues before Read more
